
The most expensive workforce decisions are the ones no one made
The most expensive workforce decisions are the ones no one made
There is a category of workforce spend most companies never see. It does not appear on a budget line. It never gets flagged in a variance report. No department owns it, and no leader is asked to justify it. And yet in most manufacturing and construction organizations, it is one of the largest ongoing expenses on the books.
The cost of doing nothing.
Every workforce decision a leader does not make is still a decision. The requisition that stays open another month because no one has time to rewrite the job description. The exit interview data no one has analyzed in a year. The manager who was promoted without training and is now watching their team turn over. The onboarding program that was designed a decade ago and never updated. The referral bonus that has not been reviewed since 2019. The stay interview that never happened because there was no time. Each of these is a decision to accept the current outcome rather than change it. And the outcomes have a cost.
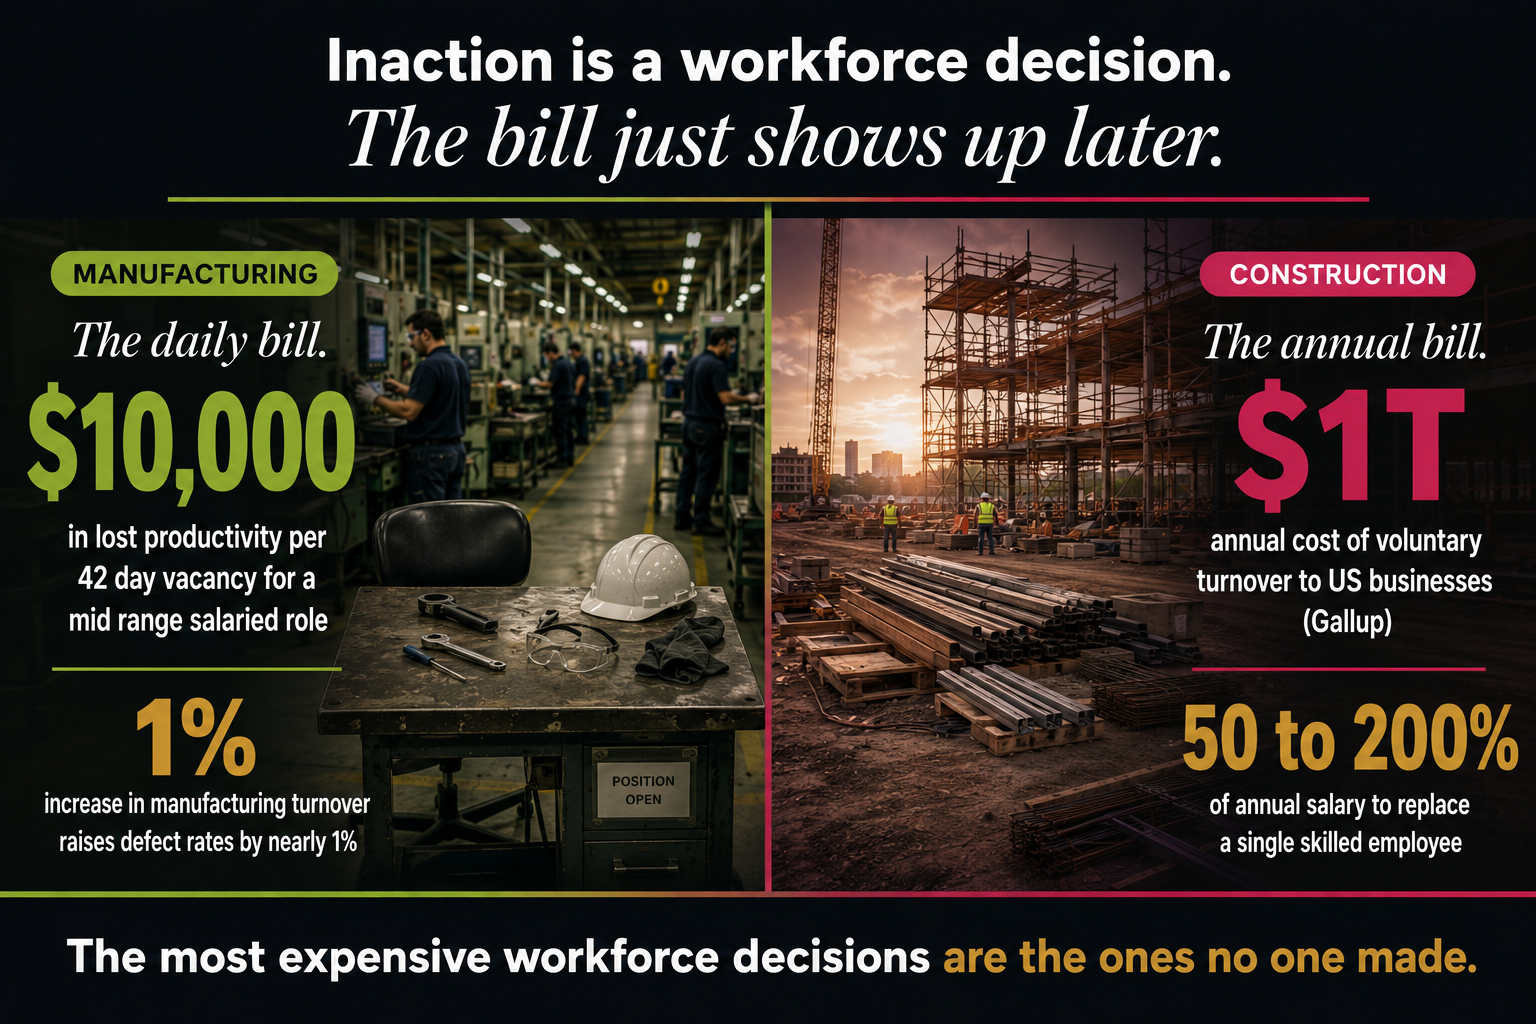
The macro numbers are striking. Gallup estimates that voluntary turnover alone costs US businesses approximately 1 trillion dollars annually. Global employee disengagement cost the world economy 10 trillion dollars in lost productivity in 2024, roughly 9 percent of global GDP. In the United States, the average time to fill an open position in 2024 was 42 days, and it has climbed since. Every additional day a role stays open compounds the operational drag on the team absorbing the missing work.
The role level math is more useful for planning purposes. For a $60,000 salaried role, every 42 day vacancy period represents roughly $10,000 in lost or redistributed productivity, before a single recruiting cost is counted. For a $90,000 mid level role, that number climbs closer to $15,000. For a senior role at $120,000, it exceeds $20,000. None of this appears in a standard cost per hire calculation. Most organizations track the recruiting fee, not the productivity gap, which means the largest cost of an open position is usually invisible in the reporting.
The industry level implications are especially significant. Wharton research on manufacturing operations found that each single percentage point increase in turnover rates increases product defects by 0.74 to 0.79 percent, translating to costs in the hundreds of millions for large operations. In construction, sustained vacancy in skilled trades roles delays project delivery, drives up overtime spend, increases safety incidents, and erodes client relationships in ways that show up long after the position is filled.
And then there is the cascade risk. Gallup research links sustained overwork to a 2.6 times higher likelihood of turnover. A team absorbing the workload of a missing colleague operates above sustainable capacity, often for months at a time. Errors compound. Quality drops. The strongest performers, the ones covering the most extra work, are also the ones with the most options. When they leave, they take institutional knowledge with them, and the original vacancy is no longer a single vacancy. It is two or three, in sequence, over the course of a year.
This is what the cost of doing nothing looks like in practice. It compounds. It multiplies. And it never shows up in the meeting where a decision could have been made to stop it.
The good news is that most of the levers to fix this are well documented and accessible. Structured hiring processes reduce turnover costs by 35 percent and improve retention by 20 percent. Strong onboarding programs improve retention by 82 percent and productivity by more than 70 percent. Stay interviews prevent up to 75 percent of departures at companies that use them. Manager development can reduce attrition by more than half. Internal mobility programs deliver higher retention, faster productivity, and lower cost per hire than external recruiting. Employee referral programs produce better hires at lower cost with longer tenure. Skills based hiring expands the qualified candidate pool by up to 19 times. Apprenticeship programs deliver 93 percent retention. Each of these strategies has been covered in this series across the past several months. Each has data supporting the investment. And each represents a specific decision a leader could make.
None of these strategies require exotic transformation. Most require deliberate design and consistent execution, over time, applied by people who are equipped to do the work. That is not glamorous. But it is what workforce strategy actually looks like when it works.
The strategic implication is straightforward. Manufacturing and construction leaders who continue to treat workforce strategy as an operational afterthought will absorb the cost of doing nothing indefinitely. That cost is real, it is compounding, and it is increasingly the difference between operational stability and operational drag. The organizations that treat workforce strategy as a core discipline, on par with safety, quality, and financial management, will build durable advantages over their peers.
At Organa, this is the work we lead alongside our clients. We help organizations identify the highest leverage workforce decisions in front of them, build the systems and practices that turn those decisions into measurable outcomes, and connect workforce strategy to the operational and financial performance of the business.
The most expensive workforce decisions are the ones no one made. The good news is that every one of them is still available to make.
Sources: Gallup State of the Global Workplace 2025 and 2026 Reports; Wharton School Manufacturing Turnover Research; SHRM 2025 Time to Fill Data; Amtec Cost of Vacancy Analysis 2026; Work Institute Retention Report; Bureau of Labor Statistics Working Days Data; Applauz Employee Turnover Cost Research